Profit Margin & Break-Even Analysis: Complete Business Formula Guide for Maximum Profitability | CalculatorLoop | Calculator Loop
business
Verified Guide
Profit Margin & Break-Even Analysis: Complete Business Formula Guide for Maximum Profitability
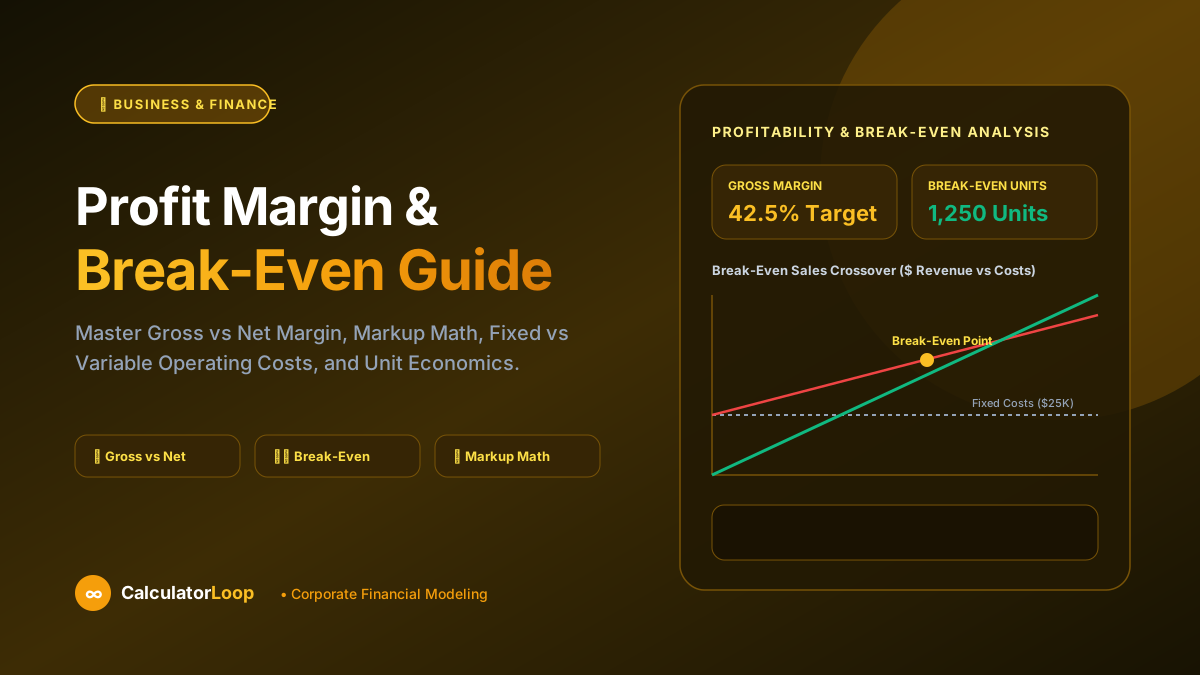
Master Gross vs Operating vs Net margin waterfall, markup vs margin conversion matrix, fixed vs variable costs, and break-even sales volume math.
📊
CalculatorLoop Business Strategy Team
Business Analysts
Reviewed by Corporate Finance & MBA Specialists
6 min read
Calculate This Instantly
Test your numbers directly with our free, real-time calculator.
Table of Contents
Profit Margin & Break-Even Analysis: Complete Business Formula Guide for Maximum Profitability
In business and entrepreneurship, the most deceptive vanity metric is top-line revenue. A startup generating 5,000,000 in gross annual sales can effortlessly slide into bankruptcy if its cost of goods sold and operating expenses outpace collections. Conversely, a boutique consultancy generating400,000 with lean unit economics and a 65% net margin can build generational wealth for its founders.
To build, scale, and protect a profitable enterprise, every business owner, financial analyst, and operator must master the twin pillars of unit economics: Profit Margin Architecture (Gross, Operating, and Net) and Break-Even Analysis.
This comprehensive financial modeling guide unpacks the mathematical formulas governing margins, clarifies the critical distinction between markup and margin, demonstrates step-by-step break-even calculations, and outlines practical levers to expand enterprise bottom-line cash flow.
1. The Anatomy of Profit Margins: Gross vs. Operating vs. Net
A profit margin measures how many cents of profit a business retains from each dollar of revenue generated after subtracting various operational expense layers.
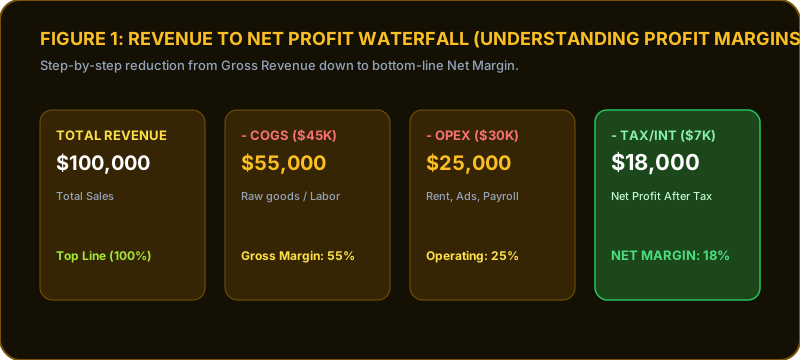
Revenue to Net Profit Margin Waterfall
1. Gross Profit Margin
Gross profit measures the fundamental production efficiency of your core product or service before corporate overheads are considered:
Gross Profit = Total Revenue - Cost of Goods Sold (COGS)
The CalculatorLoop Business Strategy Team creates actionable unit economics, break-even models, valuation frameworks, and operational margin calculators for entrepreneurs and enterprise leaders.
Put this knowledge to use with our free financial calculators
business
Verified Guide
Profit Margin & Break-Even Analysis: Complete Business Formula Guide for Maximum Profitability
Master Gross vs Operating vs Net margin waterfall, markup vs margin conversion matrix, fixed vs variable costs, and break-even sales volume math.
📊
CalculatorLoop Business Strategy Team
Business Analysts
Reviewed by Corporate Finance & MBA Specialists
6 min read
Calculate This Instantly
Test your numbers directly with our free, real-time calculator.
Table of Contents
Profit Margin & Break-Even Analysis: Complete Business Formula Guide for Maximum Profitability
In business and entrepreneurship, the most deceptive vanity metric is top-line revenue. A startup generating 5,000,000 in gross annual sales can effortlessly slide into bankruptcy if its cost of goods sold and operating expenses outpace collections. Conversely, a boutique consultancy generating400,000 with lean unit economics and a 65% net margin can build generational wealth for its founders.
To build, scale, and protect a profitable enterprise, every business owner, financial analyst, and operator must master the twin pillars of unit economics: Profit Margin Architecture (Gross, Operating, and Net) and Break-Even Analysis.
This comprehensive financial modeling guide unpacks the mathematical formulas governing margins, clarifies the critical distinction between markup and margin, demonstrates step-by-step break-even calculations, and outlines practical levers to expand enterprise bottom-line cash flow.
1. The Anatomy of Profit Margins: Gross vs. Operating vs. Net
A profit margin measures how many cents of profit a business retains from each dollar of revenue generated after subtracting various operational expense layers.
Revenue to Net Profit Margin Waterfall
1. Gross Profit Margin
Gross profit measures the fundamental production efficiency of your core product or service before corporate overheads are considered:
Gross Profit = Total Revenue - Cost of Goods Sold (COGS)
The CalculatorLoop Business Strategy Team creates actionable unit economics, break-even models, valuation frameworks, and operational margin calculators for entrepreneurs and enterprise leaders.
Cost of Goods Sold (COGS) includes direct raw materials, manufacturing labor, packaging, and freight-in shipping. It excludes marketing, rent, and corporate management salaries.
2. Operating Profit Margin (EBIT Margin)
Operating profit evaluates how efficiently management runs day-to-day corporate operations:
Operating Income (EBIT) = Gross Profit - Operating Expenses (OpEx)
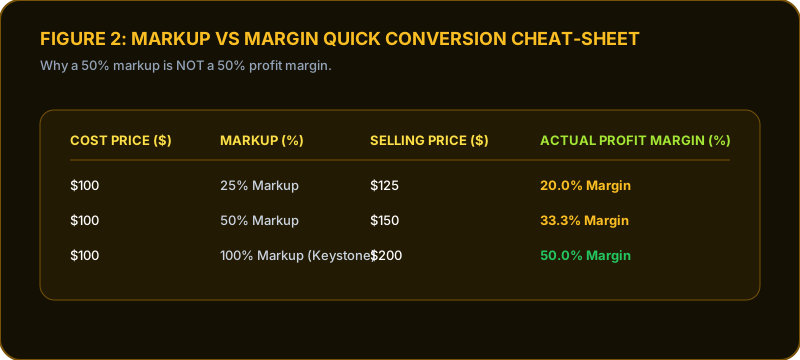
A merchant buys a gadget for $100 and desires a 50% profit margin.
The Rookie Mistake: The merchant applies a "50% markup" and prices the gadget at $150.
The Harsh Reality: Profit = 50. Dividing50 profit by the $150 selling price yields a profit margin of only 33.3%, not 50%!
The Correct Pricing Formula for Desired Margin:
Selling Price = frac{Cost Price}{1 - (Desired Margin ÷ 100)} = frac{100}{1 - 0.50} = \mathbf{\200}
To achieve a true 50% margin, the merchant must apply a 100% markup!
Conversion Matrix
Desired Profit Margin
Required Markup Percentage
10% Margin
11.1% Markup
20% Margin
25.0% Markup
33.3% Margin
50.0% Markup
50.0% Margin
100.0% Markup (Keystone Pricing)
75.0% Margin
300.0% Markup
4. Break-Even Analysis: Finding Your Zero-Risk Volume
A Break-Even Point (BEP) represents the exact sales milestone where total company revenues equal total operational costs. At this point, the business generates 0 net profit and0 net loss.
Classifying Operating Costs
Fixed Costs (FC): Expenses that remain constant regardless of production volume (e.g., warehouse rent, executive salaries, insurance).
Variable Costs (VC): Expenses that fluctuate directly in proportion to each unit sold (e.g., raw materials, packaging, credit card processing fees).
The Break-Even Equations
Contribution Margin per Unit = Selling Price per Unit - Variable Cost per Unit
Break-Even Point (Units) = frac{Total Fixed Costs}{Contribution Margin per Unit}
text{Break-Even Point (Revenue)} = \frac{\text{Total Fixed Costs}}{\text{Contribution Margin Ratio}}$
Step-by-Step Worked Calculation
A specialized coffee roasting company has monthly financial parameters: