SIP Investment Guide: How the Power of Compounding Builds Long-Term Wealth | CalculatorLoop | Calculator Loop
financial
Verified Guide
SIP Investment Guide: How the Power of Compounding Builds Long-Term Wealth
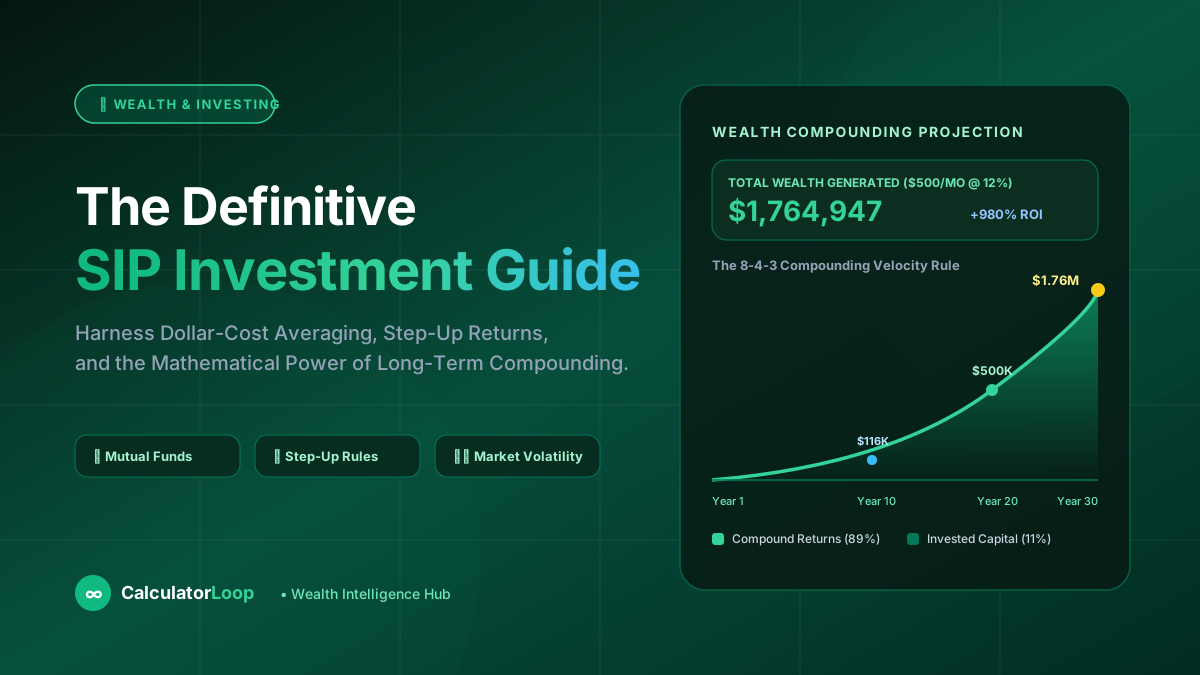
Discover how Systematic Investment Plans (SIP) harness dollar-cost averaging, compounding velocity, and step-up returns to build retirement wealth.
💼
CalculatorLoop Financial Expert Team
Financial Experts
Reviewed by Certified Financial Specialists
5 min read
Calculate This Instantly
Test your numbers directly with our free, real-time calculator.
Table of Contents
SIP Investment Guide: How the Power of Compounding and Dollar-Cost Averaging Builds Long-Term Wealth
Investing in the stock market often feels intimidating to beginners. Financial headlines scream about imminent crashes, market peaks, geopolitical shocks, and inflation spirals. Caught between the fear of losing capital and the fear of missing out, many individuals leave their hard-earned money idling in savings accounts or low-yield deposits where inflation silently erodes its purchasing power.
There is, however, a disciplined, mathematically proven vehicle that removes emotion, eliminates the futile game of market timing, and exploits compound interest to build substantial generational wealth: The Systematic Investment Plan (SIP).
1. What is a Systematic Investment Plan (SIP)?
A Systematic Investment Plan (SIP) is an investment methodology offered by mutual funds and exchange-traded fund (ETF) platforms that allows an individual to invest a predetermined, fixed sum of money into a chosen portfolio at consistent time intervals—most commonly monthly or bi-weekly.
Rather than attempting to save a massive lump sum of 50,000 and guessing whether the market is "cheap" or "expensive," SIP automates wealth accumulation by transferring as little as20, 50, or500 straight from your bank account into diversified index funds on the exact same date each month.
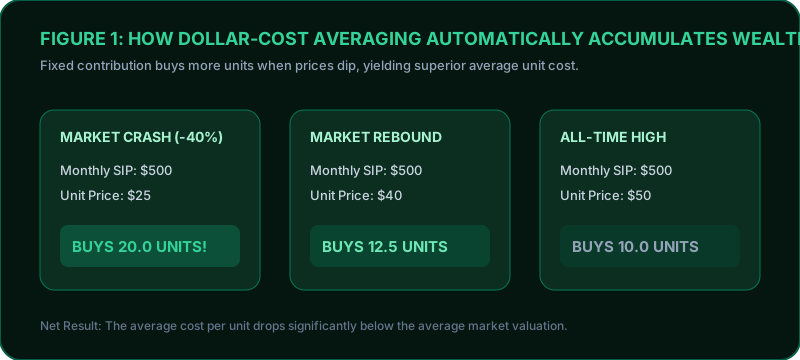
2. The Science of Dollar-Cost Averaging: Why Market Volatility is Your Friend
The greatest psychological trap in investing is attempting to time the market. When prices plummet, human psychology triggers panic, causing amateur investors to pause contributions or sell at the bottom. Conversely, when markets reach euphoric highs, investors rush in with cash.
Dollar-Cost Averaging reverses this destructive cycle automatically:
The CalculatorLoop Financial Expert Team brings together certified analysts, chartered financial modelers, and quantitative researchers to deliver transparent, institutional-grade calculation guides.
Put this knowledge to use with our free financial calculators
How Dollar-Cost Averaging Accumulates Wealth During Market Volatility
Dollar-Cost Averaging in Action: A Volatility Simulation
Let us examine an investor contributing $500 per month across 6 months of intense market fluctuations:
Month
Fund NAV (Share Price)
Monthly Investment
Units Purchased
Cumulative Units Owned
Month 1
50.00
500
10.00 units
10.00
Month 2
40.00 (Market drops 20%)
500
12.50 units
22.50
Month 3
25.00 (Market crash -50%)
500
20.00 units (Fire Sale!)
42.50
Month 4
35.00 (Recovery begins)
500
14.28 units
56.78
Month 5
45.00 (Rebounding)
500
11.11 units
67.89
Month 6
50.00 (Back to starting price)
500
10.00 units
77.89 units
The Profound Lesson:
Notice that in Month 6, the fund price returned to exactly where it started ($50.00). The market had 0% net capital growth.
Total money invested: 500 × 6 = mathbf{3,000}$
Total portfolio value: 77.89 units ×50.00 = \mathbf{\3,894.50}
Net Profit: +$894.50 (+29.8% Return) on a market that went nowhere!
3. The Mathematics of Compounding: The 8-4-3 Rule
Compound interest is not linear growth; it is exponential acceleration. When you invest, your capital generates returns. In the subsequent period, those returns generate their own returns.
The future value of a regular systematic investment plan is derived through the future value of an annuity formula:
FV = P × ((1 + r)ⁿ - 1 / r) × (1 + r)
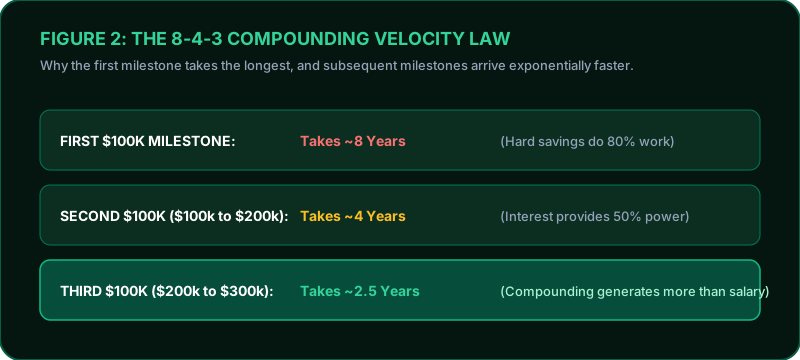
The 8-4-3 Compounding Velocity Rule
Understanding the Timeline of Milestones
First $100,000: Takes approximately 8 years of patient, daily grind. Your own savings do 80% of the heavy lifting.
Second 100,000 (from100k to $200k): Takes only 4 years. Compounding interest now accounts for over 50% of the growth.
Third 100,000 (from200k to $300k): Takes barely 2.5 to 3 years. Your accumulated returns generate more money every month than your actual salary contributions!
4. Comprehensive 30-Year Compounding Projections
Observe how a modest $500 monthly SIP compounds at an estimated 12% historical annualized stock market return:
5. The Step-Up SIP (Top-Up): How to Double Your Final Corpus
A Step-Up SIP automatically increases your monthly investment contribution by a fixed percentage (e.g., 10%) once every year.
Alex (Fixed 500/mo flat for 25 yrs): Invested =150,000| Final Wealth = 948,818
Sarah (10% Annual Step-Up starting at 500/mo): Invested =590,082| Final Wealth = 2,168,430 (+$1.2 Million more!)
6. Frequently Asked Questions (FAQ)
Q1: Can I change or pause my SIP amount anytime?
Yes. SIPs offer complete liquidity. You can modify your monthly contribution, pause payments for up to 3 to 6 months without penalties, or terminate the mandate entirely with zero exit fees on modern platforms.
Q2: What is the ideal date of the month to schedule an SIP?
The best practice is setting the SIP date 1 to 2 days after your monthly salary is credited, ensuring you pay yourself first before discretionary spending occurs.
Q3: Are returns from SIP guaranteed?
No. Equity mutual fund investments are tied to capital markets and carry market risk. However, across historical market records spanning over a century, diversified equity index holdings held for rolling 10-year or 15-year periods have consistently outpaced inflation and delivered positive compound returns.