


1. The Paradigm of Subscription Economics & Capital Efficiency
In traditional retail and enterprise software, revenue was recognized upfront via perpetual software licenses accompanied by annual maintenance agreements (typically 18–22% of license cost). Under the Cloud Software-as-a-Service (SaaS) paradigm, capital dynamics are fundamentally inverted: the software provider absorbs substantial upfront sales, marketing, and onboarding expenses to acquire a customer, recovering that capital in small, recurring monthly or annual subscription fees over time.
This economic model creates the famous Cash Flow J-Curve. When a SaaS business accelerates customer acquisition, it experiences severe initial cash burn because Customer Acquisition Costs (CAC) are recognized immediately, whereas subscription revenue compounds gradually. Consequently, institutional venture capital and private equity investors evaluate recurring revenue businesses through specialized unit economic metrics: LTV:CAC, CAC Payback Period, Net Revenue Retention (NRR), and the SaaS Magic Number.
2. Customer Lifetime Value (LTV) & Acquisition Economics
Customer Acquisition Cost (CAC) is the fully loaded expenditure required to win a single new customer:
A common pitfall is computing "Paid CAC" (only digital advertising spend) while ignoring sales representative base salaries, SDR commissions, onboarding customer success manager compensation, and marketing software subscriptions (HubSpot, Salesforce, ZoomInfo). Best practices dictate calculating Fully Loaded CAC.
2.1 Lifetime Value (LTV) Formulaic Rigor
Customer Lifetime Value represents the net gross profit a single customer contributes over their active relationship tenure before churning:
LTV = (ARPU × Subscription Gross Margin %) ÷ Monthly Customer Churn Rate
Neglecting the Subscription Gross Margin % is a critical modeling failure. If a SaaS company earns $1,000/month from a client but incurs $300/month in cloud hosting (AWS/GCP), third-party API costs (OpenAI, Stripe), and tier-1 technical support, its gross margin is 70%. Using total top-line revenue rather than gross margin overstates true equity value generation by over 40%.
2.2 The LTV:CAC Ratio Spectrum
| LTV:CAC Ratio | Operational Status | Strategic Implication |
|---|---|---|
| < 1.0× | Value Destruction | Enterprise loses cash on every acquired logo; halt acquisition spend immediately. |
| 1.0× – 2.5× | Marginal Viability | High risk; overhead or payment defaults can easily push the business into net losses. |
| 3.0× – 5.0× | Gold Standard Benchmark | Optimal capital allocation; supports aggressive sales hiring and competitive expansion. |
| > 5.0× | Underinvestment in Growth | Acquisition criteria are too strict; competitors can capture territory by outspending on ads. |
3. The MRR Bridge: Deconstructing Subscription Growth
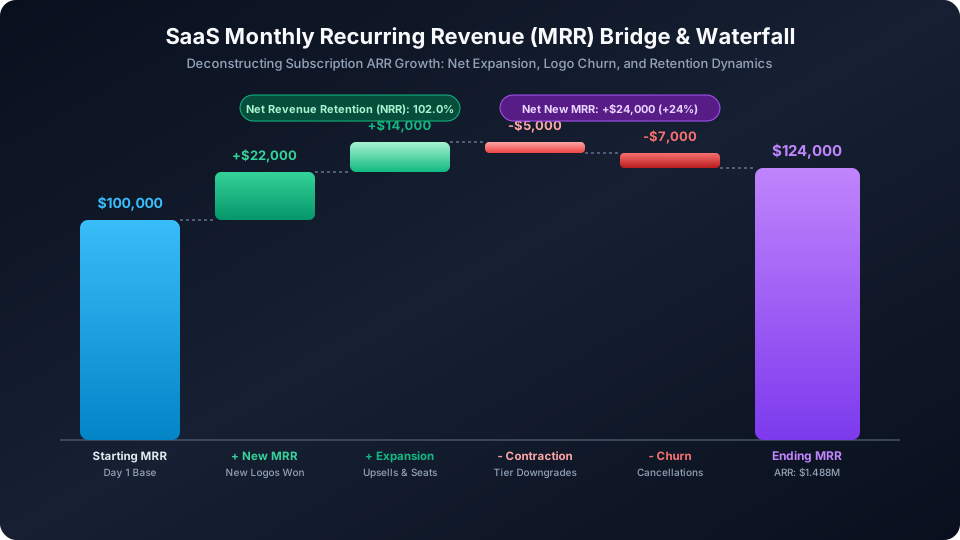
Monthly Recurring Revenue (MRR) represents normalized predictable monthly subscription billings. The movement from Beginning MRR to Ending MRR is called the MRR Waterfall:
Ending MRR = Starting MRR + Net New MRR
3.1 The "SaaS Smile" & Negative Net Churn
While logo churn is unavoidable (businesses fail, champions change roles), premier enterprise software companies achieve Net Negative Churn. This occurs when Expansion MRR (seat upgrades, module additions, usage-based consumption tiers) exceeds total revenue lost from cancellations and downgrades:
If a cohort of customers generates $100,000 in January, and by December that same cohort generates $125,000 despite losing 5% of its members, the cohort possesses an NRR of 125%. This produces the upward-curving "SaaS Smile," allowing the company to expand aggregate revenue year-over-year even with zero new customer acquisition.
4. B2B Pipeline Velocity & Funnel Throughput
Sales pipeline forecasting frequently relies on subjective rep assessments. In contrast, scientific go-to-market management utilizes the Pipeline Velocity Equation:
Where:
- N (Number of Opportunities): The total volume of qualified active sales opportunities in the pipeline.
- W (Win Rate %): Historical win rate of qualified opportunities to closed-won deals (e.g., 25%).
- S (Average Deal Size / ACV): Average annual contract value per closed deal (e.g., $30,000).
- T (Sales Cycle Duration): Elapsed calendar days from initial qualification to deal close (e.g., 60 days).
This mathematical structure reveals that shortening deal duration ($T$) accelerates bookings velocity just as effectively as generating more top-of-funnel leads ($N$).
5. Virality & The K-Factor Exponential Loop
Product-led growth (PLG) software companies (such as Slack, Figma, Dropbox, and Zoom) harness embedded referral loops. The Viral Coefficient ($K$) measures how many new users an existing user recruits:
Where $i$ represents the average number of invites, collaboration requests, or shared links generated per user, and $c$ is the conversion rate of recipient sign-ups. When $K > 1.0$, the user base compounds exponentially without paid marketing expenditure.