Date & Time Calculator
Time Tracking & Management
Calculation Inputs
Total Time8h 20m8.33 decimal hrs
Billable Total$623Avg $74.75/hr
Total Tasks4 ItemsCategorized
Category Distribution
Engineering3.8h (45.0%)
Design2.5h (30.0%)
Meetings1.3h (15.0%)
Admin0.8h (10.0%)
Algorithmic Step Derivation
// Aggregated Duration Computation
Total Decimal Hours = 8.33 hrs (8h 20m)
Gross Billable Revenue = $623 @ Effective Rate $74.75/hr
Figure 1: PERT Three-Point Estimation & Beta Probability Curve
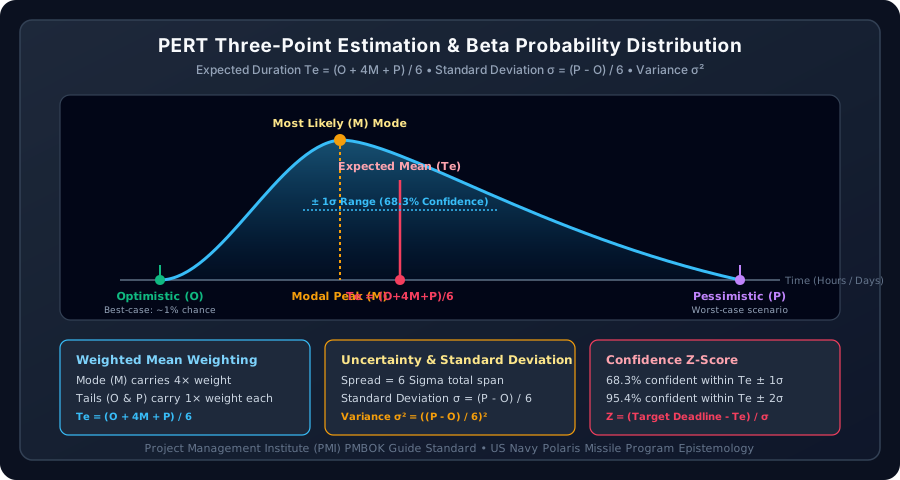
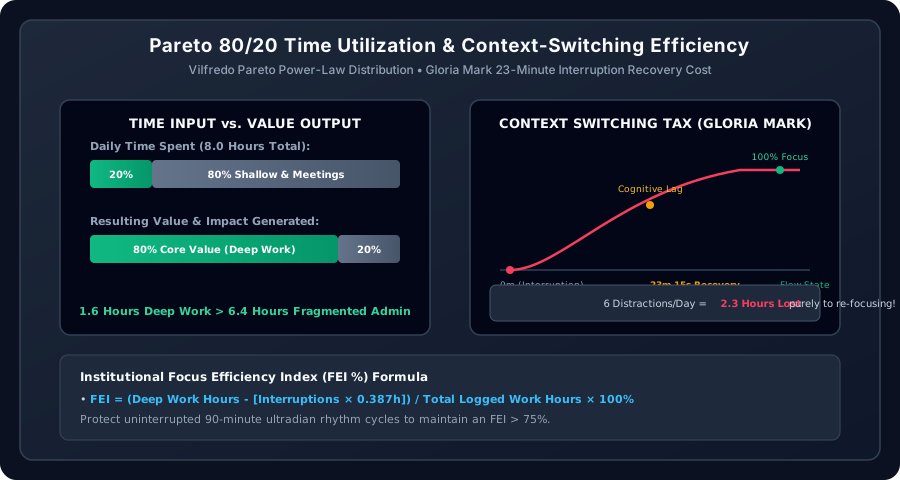
Figure 2: Pareto 80/20 Time Utilization & Context Switching Penalty
Institutional Reference: Task Estimation, Stochastic PERT Modeling, and Duration Analytics
Authoritative reference conforming to Project Management Institute (PMI) PMBOK Guide 7th Edition, IEEE Standard for Software Project Estimation, and Agile Scrum Epistemology.
1. The Mathematical Epistemology of PERT (Program Evaluation and Review Technique)
Traditional single-point time estimates (“this task will take 20 hours”) suffer from chronic cognitive biases: optimism bias, anchoring, and Hofstadter's Law (“It always takes longer than you expect, even when you take into account Hofstadter's Law”). To counter these psychological fallacies, the US Navy Special Projects Office developed PERT in 1957 during the Polaris submarine missile program.
PERT models task duration not as a deterministic integer, but as a continuous random variable following a Beta Probability Distribution. It solicits three distinct estimates from domain experts:
- Optimistic Time (O): The best-case scenario assuming everything proceeds with zero friction and 100% efficiency (the 1st percentile of the distribution).
- Most Likely Time (M): The statistical modal peak of the distribution—the duration that would occur most frequently if the task were executed 100 times under standard operating conditions.
- Pessimistic Time (P): The catastrophic worst-case scenario assuming multiple technical setbacks, dependency delays, and defect re-spins (the 99th percentile, excluding force majeure).
The expected duration $T_e$ is the weighted mean, assigning quadruple weight to the mode:
Expected Duration Te = (O + 4M + P) / 6
2. Variance, Standard Deviation, and Probability of On-Time Completion
Because the difference between pessimistic ($P$) and optimistic ($O$) estimates represents a six-standard-deviation ($6\sigma$) spread under the Central Limit Theorem, the standard deviation $\sigma$ is:
Standard Deviation σ = (P - O) / 6 • Variance σ² = ((P - O) / 6)²
To evaluate the exact mathematical probability that an engineering sprint or project will finish on or before a committed contract deadline $T_d$, project managers compute the standardized Z-Score:
Z = (Target Deadline Td - Expected Duration Te) / σ
Plugging this Z-Score into the Standard Normal Cumulative Distribution Function $\Phi(Z)$ yields the exact probability of delivering on schedule without crunch overtime.
3. Statistical Outlier Removal and Trimmed Averages in Recurring Work
In customer support ticketing, manufacturing cycle times, and agile user story completion, simple arithmetic means are highly vulnerable to extreme outliers (such as an unresolved bug lingering in code review for 3 weeks). The 10% Trimmed Mean eliminates the lowest 10% and highest 10% of durations, revealing the true underlying operational cycle time.
Frequently Asked Questions
Why does PERT assign 4× weight to Most Likely (M)?
In empirical project data, completion times are rarely symmetric bell curves (Gaussian); they are right-skewed Beta distributions with long tail risks. Giving 4 weights to the mode while granting single weights to the extreme bounds pulls the expected mean realistically toward the most probable outcome while incorporating downside asymmetry.
What is the difference between Elapsed Time and Work Hours?
Elapsed time measures total wall-clock duration between two calendar moments (including nights, weekends, and non-working hours). Work hours represent active productive hours applied to a task (typically 8.0 hours per standard business workday).
About Remaining Time Calculator
Calculate time remaining until deadline. Designed for fast, accurate calculation with clear outputs, explanation, and device-friendly usability.
Why this page helps
- Fast answers without manual formula rearrangement
- Cleaner comparison of multiple scenarios
- Works on mobile, tablet, and desktop
- Useful for study, planning, and quick verification
How to use it well
- Open the Remaining Time Calculator and enter the known input values.
- Select the correct units for each field before calculating.
- Review the main result, formula, and conversions shown on the page.
- Use the step-by-step breakdown to verify the logic and download or share the result if needed.
Expert tips
- Check that all inputs use the correct unit system before comparing values.
- Use the worked steps to confirm whether you entered the right known variables.