Health & Fitness Calculator
Sleep & Lifestyle
Mobile Hardware Electrochemistry & Device Lifecycle Suite
Smartphone Battery, Storage & Lifecycle Hub
Lithium-ion CC/CV charging physics, OLED dark mode power consumption, NAND flash capacity modeling, smartphone depreciation curves, and digital wellness screen-time analytics.
Standards:USB-IF USB-PD 3.1 / JEDEC eMMC & UFS
Screen Time & Lifetime Habit Analytics
Cumulative waking years spent on display glass and late-night sleep latency delay
US Smartphone Average: ~5.4 hours/day
Average: 80–120 pickups/day
Blue-light melatonin disruption
Lifetime Habit Projection17.9 Waking Years Lost
2,008 hrs/yr
You check your phone every 10 minutes (5.9 times/hr)
Cumulative 24-Hour Years Lost:11.9 full years on screen
Nighttime REM Sleep Delay:+31 mins to fall asleep
Step-by-Step Mathematical Derivations & Electrochemical Formulas
Storage and smartphone lifecycle depreciation curves follow standard consumer electronics decay functions:
1. Formatted NAND Capacity = Binary GiB conversion = Storage Tier * 0.93 - System OS (22 GB)
2. Trade-in Residual Payout = Original MSRP * Brand Retention Curve (apple) * Condition Multiplier
3. Lifetime Waking Screen Years = (Daily Hours * 365 * Remaining Years to Age 80) / (16 Waking Hours * 365)
Lithium-Ion Charging Dynamics
CC/CV Two-Stage Profile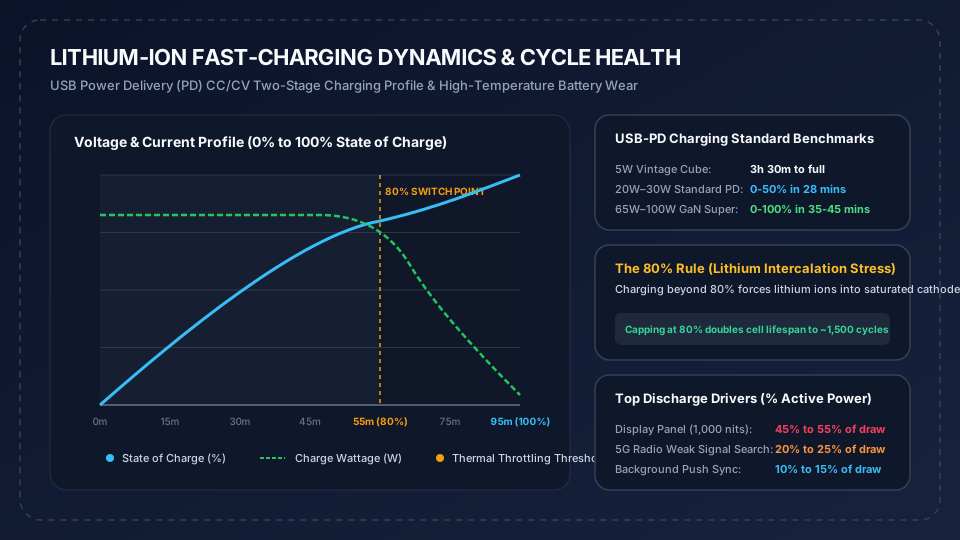
Detailed visualization of the 80% saturation switch point, thermal throttling, and cell cycle longevity.
Storage & Trade-in Depreciation
NAND Flash & 4-Yr MSRP Loss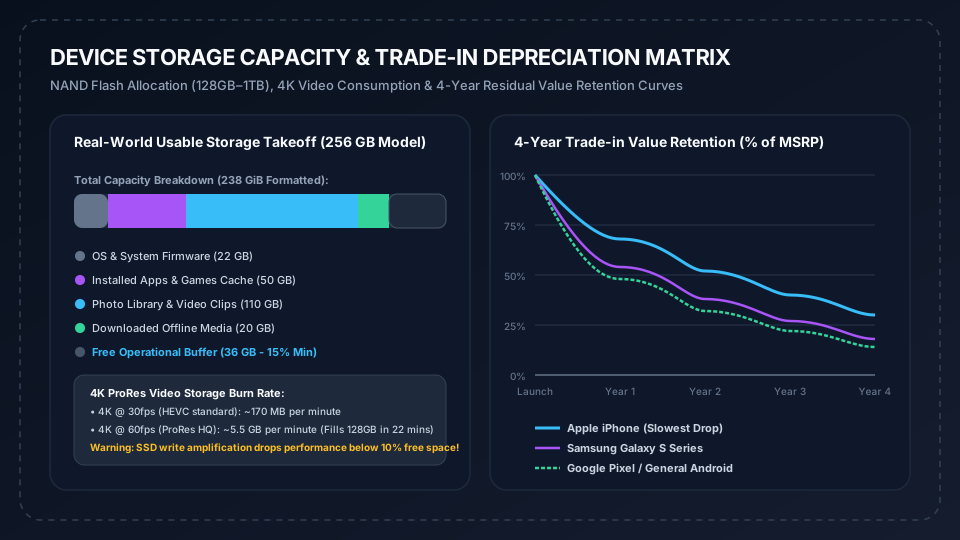
NAND flash partition allocation breakdown and 4-year residual value retention curves across Apple, Samsung, and Google.
The Comprehensive Engineering Guide on Smartphone Electrochemistry, Storage & Lifecycle Economics
Modern mobile devices are sophisticated thermodynamic machines where lithium-ion electrochemistry, display emitter power physics, and solid-state flash memory interact with economic depreciation cycles. Understanding these mechanics extends smartphone longevity and optimizes trade-in returns.
1. Lithium-Ion Battery Electrochemistry: The 80% Charging Threshold
Rechargeable smartphone batteries utilize lithium cobalt oxide (LiCoO2) or lithium nickel manganese cobalt (NMC) chemistries. Battery degradation is driven by two primary physical stressors: high state of charge (voltage stress) and elevated temperature:
- Intercalation Stress at 100%: When a lithium-ion battery is charged above 80%, the lithium ions are tightly packed into the cathode crystal lattice at higher cell voltages (typically 4.35V to 4.45V). This continuous high potential causes micro-cracking in cathode particles and accelerates electrolyte decomposition (SEI layer thickening).
- The 80% Battery Health Rule: Limiting maximum daily charge to 80% (available natively in modern iOS and Android battery health settings) reduces mechanical cell expansion and extends total battery cycle lifespan from ~500 cycles to over 1,500 cycles (approximately 4 to 5 years of daily use before reaching 80% capacity retention).
- Thermal Runaway Prevention: High-wattage fast charging (30W to 65W) generated heat must be dissipated. Charging while playing graphic-intensive games or leaving the phone under a pillow traps heat above 40°C, causing permanent irreversible capacity loss.
2. Display Technology Power Physics: OLED Dark Mode vs IPS LCD
The smartphone display is universally the single largest electrical consumer in mobile hardware:
- OLED Pixel Self-Emission: In Organic Light Emitting Diode (OLED) displays, every individual subpixel emits its own light. When rendering pure black (#000000), the pixels are completely turned off, consuming 0.00 Watts. Enabling system-wide Dark Mode on an OLED device saves between 25% and 38% total daily battery energy.
- IPS LCD Backlight Draw: Traditional LCD screens utilize a continuous LED backlight that remains fully illuminated regardless of whether the screen is displaying a dark or light image. Consequently, Dark Mode yields virtually zero energy savings on LCD panels.
- High Refresh Rate (120 Hz) Penalty: Driving a display at 120 frames per second requires double the GPU pixel fill rate and display controller clock cycles, adding 15% to 25% additional display power consumption compared to standard 60 Hz.
3. NAND Flash Storage & The 15% SSD Performance Buffer
Smartphones utilize 3D TLC or QLC NAND flash memory orchestrated by an integrated Universal Flash Storage (UFS) or NVMe controller:
- Write Amplification & Garbage Collection: Solid-state flash memory cannot overwrite existing data directly; it must erase an entire memory block before rewriting individual pages. When free storage drops below 10% to 15%, the controller struggles to find clean blocks for garbage collection, causing severe lag, app launch stutter, and accelerated NAND flash wear.
- 4K ProRes Video Ingestion: Recording 4K video at 60fps in Apple ProRes or uncompressed RAW formats generates 5.5 Gigabytes per minute. A base 128 GB smartphone with only 80 GB of usable free space will fill completely after just 15 minutes of continuous shooting. Content creators require a minimum of 512 GB or 1 TB internal storage.
4. Smartphone Trade-in Economics: The Apple vs Android Residual Gap
Secondary market data over 10 years consistently confirms that Apple iPhones retain residual monetary value significantly better than Android flagships:
The 2-Year Upgrade Sweetspot:
An iPhone 14 Pro purchased for $999 retains approximately 52% of its value ($520) after 24 months, whereas a comparable Samsung or Google flagship retains approximately 32% to 38% ($320 to $380).
The Carrier Promo Trade-in Dynamic: US carriers (AT&T, Verizon, T-Mobile) frequently offer $800 to $1,000 in trade-in credits for 2-to-3-year-old devices. However, this credit is distributed across 36 monthly bill credits, effectively acting as an unadvertised 3-year service contract lock-in.
About Screen Time Calculator
Track and manage screen time. Clinically grounded fitness and body composition calculator providing instant benchmarks, healthy target ranges, and exportable reports.
Why this page helps
- Enables proactive lifestyle and wellness planning
- Provides instant benchmarks without complex manual math
- Fully private and ad-free computational environment
How to use it well
- Select the appropriate units (metric or imperial).
- Input your personal physical parameters carefully.
- Review the generated outputs, clinical ranges, and recommendations.
- Export or share your summary for reference during fitness planning.
Expert tips
- Consistency in measurement timing (same time of day, same conditions) produces the most meaningful trends.