Construction Calculator
Cost Estimation & Budget
Category 2: ConstructionSubcategory 5: Contracts & Feasibility
Project Feasibility, Cash Flow & Contract Economics Suite
Phase-wise S-curve milestone cash flow disbursement, development ROI & cap rate modeling, contractor bid markup anatomy, structural teardown debris balance, and municipal permit sanction fees.
Currency:
Unit:
Phase-Wise S-Curve Construction Budget Schedule
Milestone PhasingReal-Time Mathematical Derivation:
1. Substructure Earthwork & Footings (15%) = $75,000
2. Superstructure RCC & Masonry (35%) = $175,000
3. MEP Services (20%) = $100,000 | Finishes (20%) = $100,000
4. Peak Monthly Funding Requirement = $60,417
Contract & Feasibility Benchmark
$500,000
Project Duration: 12 Months (S-Curve Phasing)
Economic Milestone Allocations
Phase 1: Substructure & Plinth (15%)$75,000
Phase 2: Superstructure Frame (35%)$175,000
Phase 3: MEP & Enclosure (20%)$100,000
Phase 4: Architectural Finishes (20%)$100,000
Phase 5: Closeout & Retainage (10%)$50,000
S-Curve Milestone Weight100% Phase Completion
Contracting & Feasibility Rules of Thumb
Retainage (Defect Liability):5% to 10% withheld for 12 months
Target Developer Profit Margin:18% to 25% on GDV
Contractor Net Profit Target:8% to 12% on Total Bid
Architect & Engineering Fees:4% to 8% of Construction Capex
Permits & Impact Fees:1% to 2.5% of declared valuation
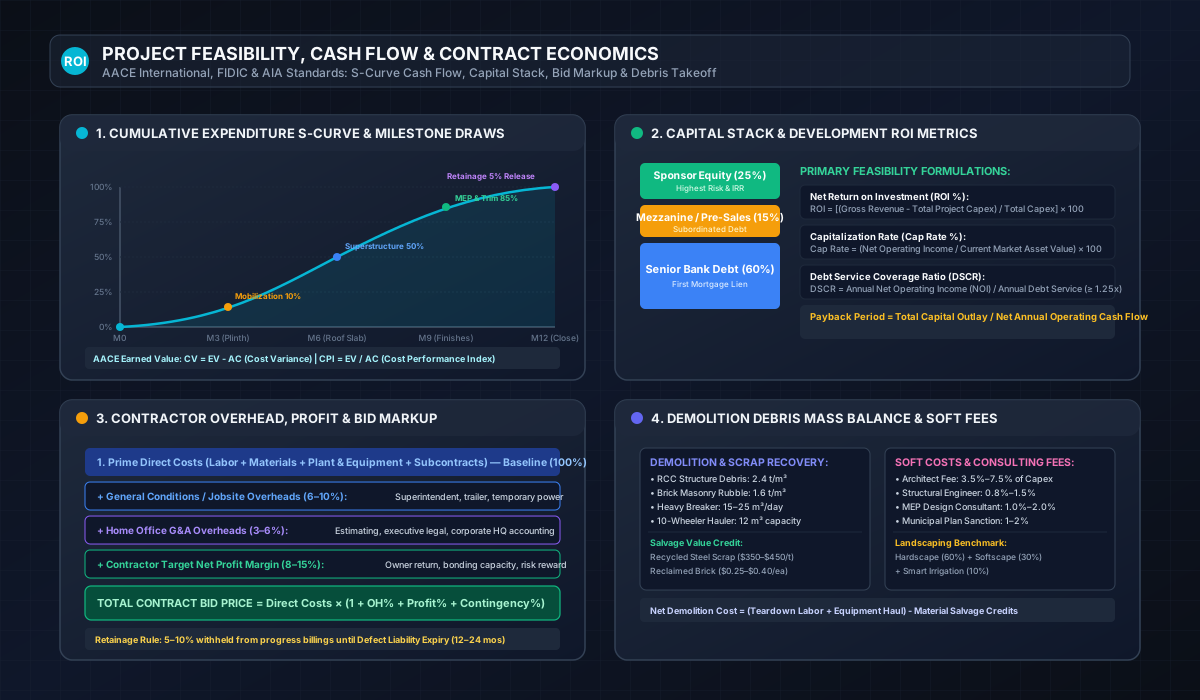
Institutional Infographic: Project Feasibility & Contract Economics
Visual technical diagram featuring the AACE International cumulative S-curve, real estate development capital stack, contractor bid markup anatomy, and demolition debris mass balance.
E-E-A-T Academic Engineering Manual
Contract Management, Cash Flow Phasing & Feasibility Modeling
Professional guidelines grounded in the Fédération Internationale Des Ingénieurs-Conseils (FIDIC) Red & Yellow Books, the American Institute of Architects (AIA) Document A201, and AACE International Cost Engineering Standards.
1The Mechanics of the Construction Cash Flow S-Curve
In capital project delivery, cash flow does not disburse at a linear rate. Due to procurement lead times, mobilization overheads, weather contingencies, and the sequence of trade handoffs, cumulative expenditure follows a characteristic cumulative bell curve known as the S-Curve. Understanding the mathematical dynamics of the S-Curve is mandatory for developers, general contractors, and lending institutions managing construction loan drawdowns.
The project lifecycle decomposes into three distinct financial velocities:
- Initial Mobilization & Groundbreaking (Months 1–3): Cash burn is relatively slow (10% to 15% of total capital). Expenses center on site hoarding, temporary power and water lines, soil investigations, earth excavation, and foundation blinding concrete.
- Superstructure Acceleration & Shell Casting (Months 4–8): The curve steepens dramatically. This represents the peak financial burn rate (35% to 45% of total capital), where high-intensity procurement of rebar, ready-mix concrete, formwork systems, and heavy tower cranes dominates the monthly invoice.
- Finishing, Testing & Commissioning (Months 9–12+): Financial velocity decelerates as the building envelope closes. Trades shift from structural concrete gangs to specialized electrical, HVAC, tiling, and joinery crews. The final 5% to 10% is typically held as retainage until snag list resolution.
2Real Estate Development Capital Stack & Feasibility Metrics
A real estate project’s financial viability relies on the Capital Stack—the hierarchy of capital sources funding the land and building acquisition. The capital stack determines the risk-return profile:
Standard Capital Stack Hierarchy:
1. Senior Debt (Bank Loan / Construction Financing):55% – 65% of Total Capex (Lowest Risk / 6%–10% Interest)
2. Mezzanine Debt / Pre-Sales Inflows:15% – 20% of Total Capex (Subordinated Lien)
3. Sponsor Equity (Developer Capital):20% – 30% of Total Capex (First Loss / Highest Target IRR)
Institutional feasibility evaluates three core metrics:
- Return on Investment (ROI %): [(Gross Development Value - Total Capital Outlay) / Total Capital Outlay] × 100. Target benchmark for residential land development is typically ≥ 20%.
- Capitalization Rate (Cap Rate %): Net Operating Income (NOI) / Current Asset Market Value. Standard institutional cap rates range between 4.5% and 8.0% depending on geographic tier.
- Debt Service Coverage Ratio (DSCR): Net Operating Income / Total Debt Service. Commercial banks require a minimum DSCR of 1.25x to 1.35x before approving construction financing.
3Contractor Bid Markup Anatomy & Retainage Dynamics
When general contractors submit competitive tenders under AIA Document A201 or FIDIC conditions, the total bid price is built systematically on top of Prime Direct Costs:
General Conditions (Jobsite Overheads)
Directly associated with project management on-site: Project Superintendent salary, safety engineer, field office trailers, temporary site security fencing, portable toilets, water/power hookups, and waste dumpsters. Typically 6% to 10% of prime direct cost.
Home Office Overhead & Profit
Corporate administrative expenses (G&A: central estimating department, legal counsel, executive board, headquarters rent) combined with the contractor’s target pre-tax net profit margin (8% to 14%).
The Role of Retainage: Construction contracts routinely authorize the client to withhold 5% to 10% from each intermediate progress payment certificate. This retainage fund acts as financial security guaranteeing that the contractor rectifies all defective work during the Defect Liability Period (typically 12 to 24 months post-handover).
4Demolition & Environmental Waste Mass Balance
Demolition planning requires rigorous volumetric mass balance calculations. Structural teardown generates massive quantities of inert rubble that must be cleared before new construction can commence. Debris density varies widely depending on the structural framework:
| Structural Typology | Debris Bulk Density | Demolition Rate ($/sq ft) | Salvage Scrap Potential |
|---|---|---|---|
| Reinforced Concrete (RCC Frame) | 2.2 – 2.4 Tons / m³ | $10 – $16 / sq ft | High: TMT rebar scrap ($350–$450/ton) |
| Load-Bearing Brick Masonry | 1.5 – 1.8 Tons / m³ | $7 – $11 / sq ft | Moderate: Reclaimed heritage bricks |
| Timber / Lightweight Wood Frame | 0.4 – 0.6 Tons / m³ | $4 – $8 / sq ft | Low: Salvageable dimensional beams |
About Construction Budget Planner
Institutional project feasibility, contract economics, and construction cash flow calculation workstation. Plan milestone S-curve disbursements, evaluate real estate development ROI and Cap Rates, calculate structural demolition debris balance, estimate landscaping and municipal permit fees, and structure contractor bid markups per FIDIC and AIA guidelines.
Why this page helps
- Ensures precise milestone cash flow forecasting to avoid mid-project construction loan defaults
- Delivers transparent bid markup breakdowns protecting contractor profitability and bonding capacity
- Enables rigorous financial due diligence before committing substantial capital to land acquisition
How to use it well
- Select your project feasibility or contracting tool (Budget Planner, Development ROI, Demolition Takeoff, Landscaping, Permit Fees, Architect Fees, or Contractor Margin).
- Input financial parameters: total estimated budget, land acquisition cost, prime direct expenses, building gross floor area, or project duration in months.