Construction Calculator
Cost Estimation & Budget
Category 2: ConstructionSubcategory 5: Cost Estimation
Building Economics & Budget Feasibility Suite
Turnkey house construction modeling, structural civil takeoff, turnkey interior fit-out, gut remodel depreciation, trade labor gangs, and material BOQ index according to CPWD, RICS, and RSMeans standards.
Currency:
Unit:
Turnkey Interior Fit-Out Scope
Joinery, False Ceiling & FinishesReal-Time Mathematical Derivation:
1. False Ceiling = $7,875 (75% coverage)
2. Modular Kitchen (24 rft) = $6,960 | Wardrobes (180 sqft) = $6,840
3. Designer / PM Fee (10%) = $10,288
4. Grand Total Interior Capex = $113,163 ($81/sqft)
Total Budget Forecast
$113,163
$81 / sqftEffective Unit Rate
Major Cost Allocations
Modular Kitchen Cabinetry$6,960
Wardrobes & Storage Joinery$6,840
False Ceiling & Lighting$7,875
Design Supervision Fee (10%)$10,288
Proportion Breakdown Meter100% Capital Outlay
Standard Institutional Benchmarks (RSMeans / CPWD)
Cement Consumption:0.40–0.45 bags / sq ft built-up
Steel Rebar Intensity:3.5–4.2 kg / sq ft (RCC framed)
Aggregate & Sand Mix:1.8 cu ft sand + 1.4 cu ft aggregate / sq ft
Labor-to-Material Ratio:30% Labor : 70% Material (Civil)
Contractor Margin & Overhead:10–15% on Prime Direct Cost
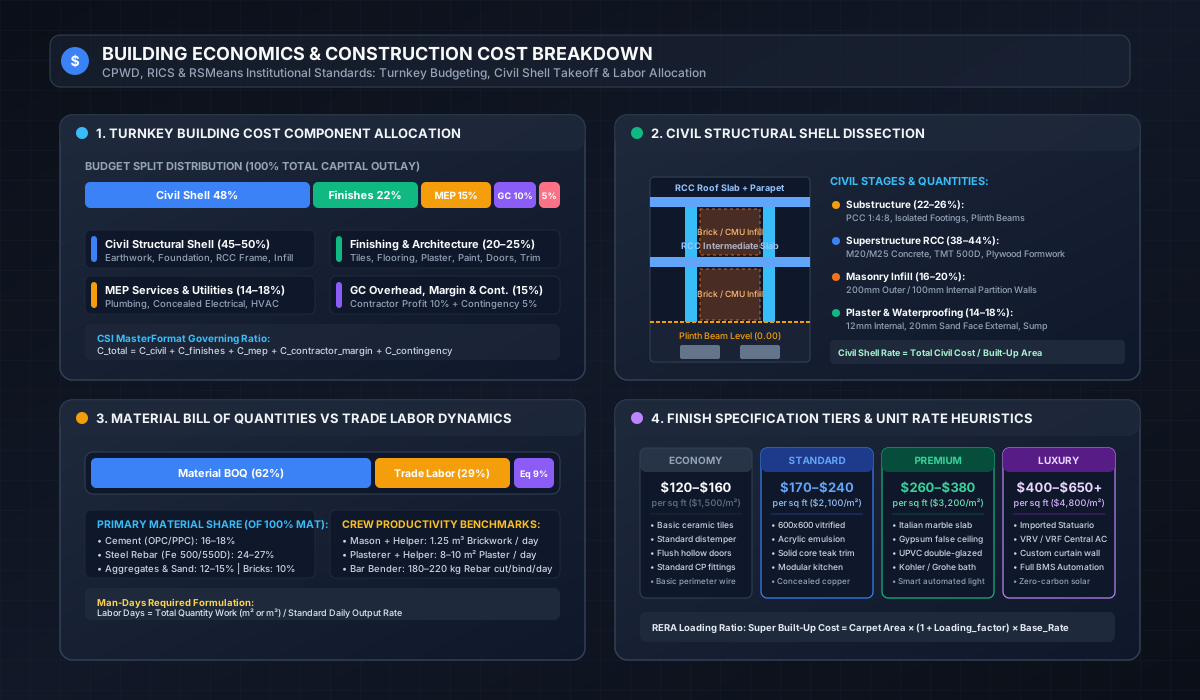
Institutional Infographic: Building Economics & Cost Breakdown
Visual technical reference illustrating the CSI MasterFormat capital outlay distribution, RCC framed civil shell levels, trade crew productivity benchmarks, and finish quality tiers.
E-E-A-T Academic Engineering Manual
The Comprehensive Guide to Construction Cost Engineering, Quantity Surveying & Budget Control
Authoritative guidelines grounded in the Royal Institution of Chartered Surveyors (RICS) Black Book, AACE International Recommended Practices, and the Central Public Works Department (CPWD) Analysis of Rates.
1Foundations of Capital Expenditure (CapEx) in Building Construction
Estimating the cost of building construction is one of the most critical risk-management disciplines in civil engineering and real estate development. According to empirical studies published by the Construction Industry Institute (CII) and the American Association of Cost Engineers (AACE International), more than 65% of mega-projects and 42% of residential developments experience cost overruns exceeding 15% of the baseline budget. These overruns stem primarily from inadequate early-stage work breakdown structures (WBS), unhedged material price volatility, and omission of site-specific geotechnical parameters.
In institutional cost accounting, the Total Capital Outlay (C_total) of a building is partitioned across five standardized economic buckets:
C_total = C_civil + C_finishes + C_mep + C_gc_margin + C_contingency
- Civil Structural Shell (45%–50%): Covers substructure excavation, mud mat (PCC), reinforced concrete footings, grade plinth beams, superstructure columns, tie-beams, two-way slabs, exterior masonry envelope, and weatherproofing renders.
- Finishes & Architectural Enclosure (20%–25%): Encompasses vitrified/marble floorings, ceramic wall tiling, internal gypsum skim plaster, multi-coat acrylic emulsion painting, fenestrations, doors, and millwork.
- Mechanical, Electrical, and Plumbing (MEP) Services (14%–18%): Internal conduit wiring, main distribution boards (MDB), copper earth pits, PVC/CPVC supply networks, soil-waste drainage stacks, sanitary ware, and HVAC ventilation ducting.
- General Contractor Overhead & Profit (10%–12%): Jobsite management (superintendents, site engineers, safety officers, storage sheds), home office corporate administrative overhead (G&A), and net profit margin.
- Contingency Reserve (5%–10%): Unforeseen subsurface anomalies, seasonal monsoon disruptions, and market-driven price fluctuations during the 12-to-24-month execution lifecycle.
2Civil Structural Shell Takeoff: Materials & Mix Design Heuristics
The structural shell constitutes the largest single risk item in project execution. Material consumption rates vary based on whether the design conforms to seismic zone detailing standards (e.g., IS 13920 / ACI 318 ductile detailing) or basic gravity frames. Over decades of institutional practice, seasoned quantity surveyors utilize the following empirical benchmarks per 1,000 square feet (92.9 square meters) of gross built-up area:
| Material Commodity | Standard Consumption (per 1,000 sq ft) | Typical Wastage Allowance | Cost Impact (% of Civil) |
|---|---|---|---|
| Ordinary Portland / Pozzolana Cement | 400 – 440 Bags (50 kg each) | 2% – 3% (handling / spillage) | 16% – 19% |
| Thermo-Mechanically Treated (TMT) Rebar | 3.5 – 4.2 Metric Tons (Fe 500/550D) | 4% – 5% (cutting offcuts & lap splices) | 24% – 28% |
| Manufactured Sand (M-Sand / Zone II) | 1,800 – 2,100 cu ft (60 – 70 Tons) | 5% – 8% (screenings & wind erosion) | 8% – 10% |
| Crushed Coarse Aggregate (20mm / 10mm) | 1,350 – 1,550 cu ft (80 – 90 Tons) | 3% – 5% (segregation & subbase bedding) | 7% – 9% |
| Modular Red Clay Bricks / AAC Blocks | 18,000 – 22,000 Bricks (or 1,800 AAC Blocks) | 5% – 8% (transit chipping & bat cuts) | 12% – 15% |
3Trade Labor Gang Outputs and Productivity Scheduling
Labor costs typically account for 28% to 32% of total civil shell outlays. However, labor productivity is notoriously susceptible to climate variations, site access constraints, and hoisting logistics. Under the CPWD Schedule of Rates and UK Spons Architects and Builders Price Book, labor calculations are derived from gang outputs—the volume of work a standardized team of skilled artisans and unskilled laborers can execute during an 8-hour shift.
Masonry & Plastering Gangs
One skilled mason accompanied by one unskilled helper typically lays 1.25 m³ of 200mm thick brickwork in 1:6 cement mortar per 8-hour shift. In internal wall plastering (12mm thickness in 1:4 mortar), the same pair delivers 8 to 10 square meters per day, including floating and surface troweling.
Bar Bending & Formwork Gangs
A skilled bar bender cuts, bends, and ties 180 to 220 kg of rebar cage per day for foundation footings and columns, and approximately 140 to 170 kg for dense slab mesh. A shuttering carpenter gang (1 carpenter + 1 helper) erects and braces 12 to 15 m² of plywood formwork per day.
4Interior Fit-Out & Finishing Economics
Turnkey interior costs fluctuate drastically depending on the chosen aesthetic specification tier. While civil structural costs scale linearly with floor plate area and storey count, interior fit-outs represent high-value custom fabrication with extreme unit-price variance:
Essential Fit-Out
Targeted at rental yields or affordable residences.
- • Pre-laminated particle board joinery
- • Standard acrylic emulsion paints
- • Basic perimeter gypsum coves
- • Standard stainless steel sink & taps
Executive Grade
Modern middle-to-upper residential standard.
- • Marine-grade BWP plywood cabinetry
- • Soft-close Blum/Hettich drawer runners
- • Full gypsum false ceilings with COB spots
- • Quartz or granite countertop slabs
Ultra-Luxury Grade
High-end bespoke custom architectural spaces.
- • Natural smoked oak / walnut veneer
- • Bookmatched Italian Statuario marble
- • Centralized VRV / VRF climate control
- • Automated motorized drapery & lighting
5Real-World Case Study: 4,000 Sq Ft G+1 Suburban Residence
Project Scope & Assumptions:
A two-storey suburban home with 2,000 sq ft ground floor plate and 2,000 sq ft first floor plate (Total Built-Up: 4,000 sq ft). Executed under Standard Specification Class on normal flat terrain with a 1.05 urban metro cost index.
• Baseline Standard Rate: $195.00 / sq ft
• Adjusted Rate: $195 × 1.00 × 1.05 = $204.75 / sq ft
• Civil Structural Shell (48%): $393,120
• Architectural Finishes (22%): $180,180
• MEP Building Services (15%): $122,850
• General Contractor Margin (10%): $81,900
• Contingency Fund (7%): $54,463
• Total Turnkey Cost: $832,513 ($208.13 / sq ft)
Key Takeaway: By tracking the 48/22/15/10/5 institutional ratio, the owner successfully hedged structural risk upfront while maintaining a healthy 7% contingency reserve for interior customizations during month 10.
About Interior Design Cost
Comprehensive building economics and construction cost estimation workstation. Calculate turnkey house construction budgets, structural civil shell costs, interior fit-outs, gut remodel expenses, trade labor gang productivity, material bills of quantities, and per-sq-ft unit rates based on RICS and CPWD standards.
Why this page helps
- Prevents severe budget overruns by incorporating standardized 5% to 15% contingency reserves
- Delivers accurate material requirement quantities alongside financial cost forecasts
- Aligns project budgets with recognized international standards (RICS, RSMeans, and CPWD)
How to use it well
- Select your desired building economics calculator module (Turnkey Cost, Civil Shell, Interior Fit-Out, Renovation, Trade Labor, Material BOQ, or Per Sq Ft Rate).
- Input project dimensions: floor plate area, number of storeys, and total built-up or carpet area in square feet or square meters.
- Choose quality specification grade: Economy (basic ceramic), Standard (vitrified & modular kitchen), Premium (Italian marble & false ceilings), or Luxury (VRV AC & smart automation).